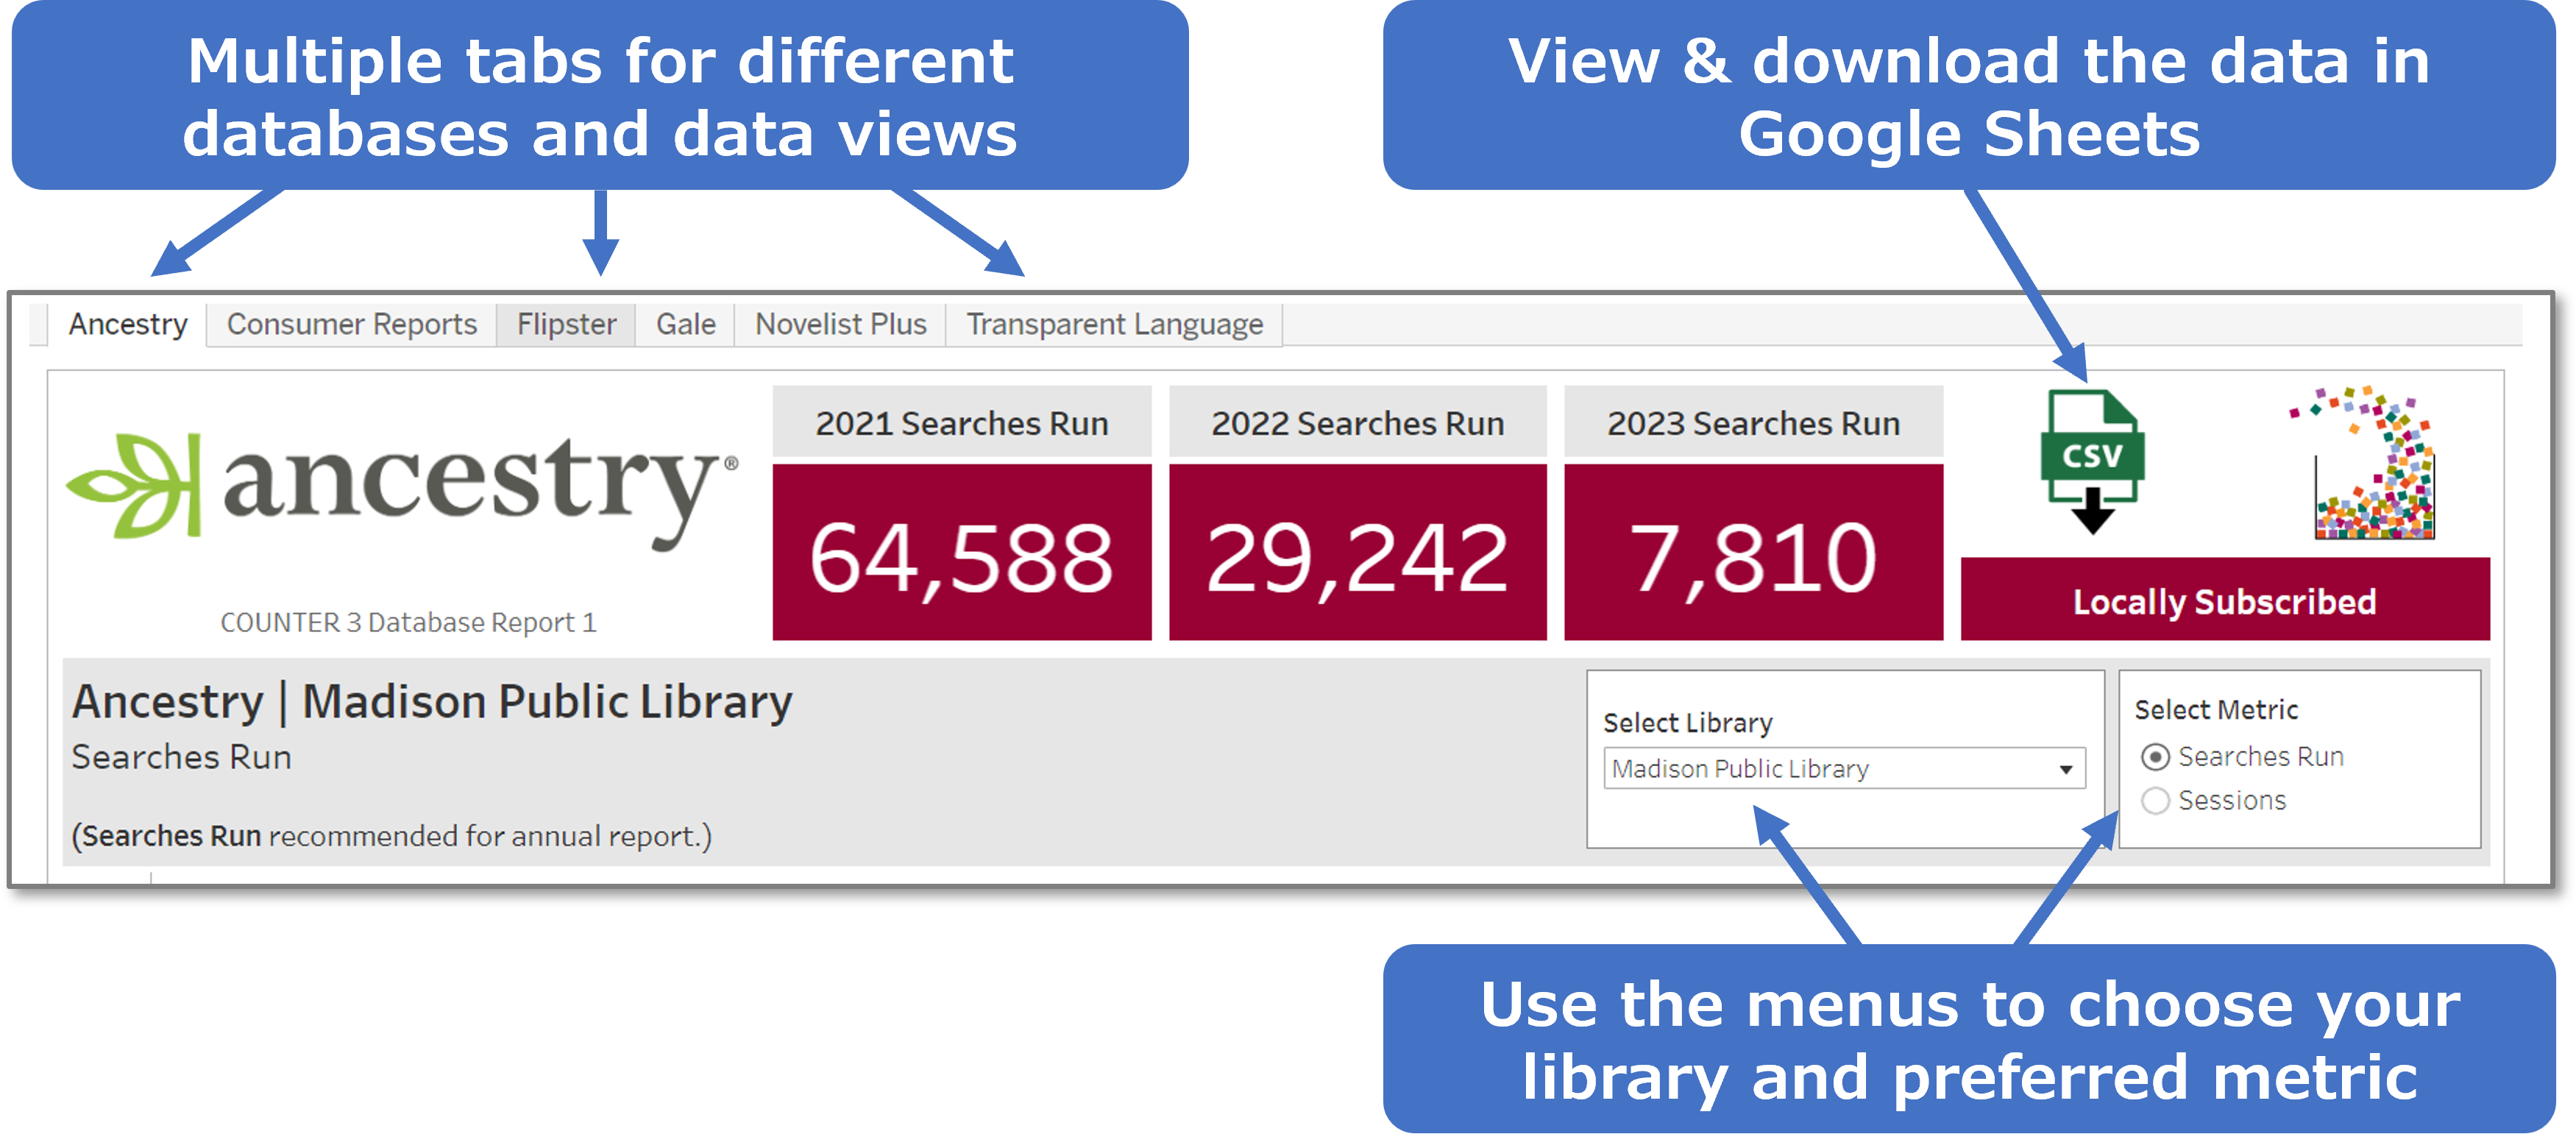
Reference Database Use by Library
2011
Notes about 2011 statistics
In-Library Use
• 2011 In-Library use (pdf)
• 2011 In-Library use by month (pdf)
• 2011 In-Library use with percent of system use (pdf)
• 2011 In-Library use spreadsheet (includes sheets for "by library", "by month", and "as percent of system use") (xls)
• 2011 In-Library Passthroughs (pdf)
Remote Use
• 2011 Remote use (pdf)
• 2011 Remote use by month (pdf)
• 2011 Remote use with percent of system use (pdf)
• 2011 Remote use spreadsheet (includes sheets for "by library", "by month", and "as percent of system use") (xls)
Pass-Through Use
• 2011 Pass-Through use (xls)
2010
Explanation of 2010 statistics
In-Library Use
• 2010 In-Library use (pdf)
• 2010 In-Library use by month (pdf)
• 2010 In-Library use with percent of system use (pdf)
Remote Use
• 2010 Remote use (pdf)
• 2010 Remote use by month (pdf)
• 2010 Remote use with percent of system use (pdf)
2009
• Explanation of statistics
In-Library Use
• 2009 In-Library use (pdf)
• 2009 In-Library use (breakdown by library network) (pdf)
• 2009 In-Library use by month (pdf)
Remote Use
• 2009 Remote use (pdf)
• 2009 Remote use by month (pdf)
|
OverDrive Statistics by Library
• Jan - Dec 2011 (below chart)
• 2010 (below chart)
• (Jan-July 2011) Comparison of 2010 and 2011 Totals by library (.xls)
• Final Comparison of 2010 and 2011 Totals by library (.xls)
2009-2011 OverDrive Checkouts By Month
Each Library has its own worksheet/tab in one of the Excel workbooks below.
OverDrive checkout stats are based on a patron's PSTAT (statistical code based on their residential address). If they live in a municipality with a library, their OverDrive use is attributed to their municipality's library. If they live outside of a municipality with a library, that use is attributed to the county in which they reside.
•
Libraries A-M (xls)
• Libraries N-W and County Use (xls)
|